 Exhibitions are an effectual marketing tool often used by organizations to increase their access to clients. However, the whole exercise can go haphazard in the absence of a useful 'analytical and computational' device. BSC (Balanced Scorecard) fills the gap well with its calculative approach. The perspectives whose tracking can be beneficial are- Channel Building and Public Relations Perspective, Customer Relationship Perspective, Learning Effects Perspective and Reach Perspective. The indicators for Channel Building and Public Relations Perspective can be- Number of journalists/ editors entertained, Number of column inches managed, Number of Partners, Brand Awareness Index and Media Coverage gained. Moving on, the KPIs for Customer Relationship Perspective are Level of customer relationships, Customers' Education Index, Positive Responses' Fraction and Improvement in reputation and relationship scores with customers.Further, one can assess the Reach Perspective using indicators such as- Average 'Target Audience' concentration, Average Length for which the event was attended, Percentage rise in number of visitors and Comparison scaling.Lastly, the Learning Effects Perspective can be evaluated with metrics such as- Cost: Benefit ratio Improvement, Learning curve Effect, Increase in Conversion rate and Number of exhibitions organized.
![]()
![]()
![]()
Read Why do business professionals choose ready-to-use KPIs? to find out the answers to these questions:

Ideally, you need to have a strategy (in a form of a strategy map) before you start thinking about the ways to measure its execution (KPIs). Don't have a strategy map yet? Use free Strategy Map Wizard to create a strategy map for your current business challenges. The wizard will:
The whole process takes on average 6 minutes. Give it a try right now - it's free.
Exhibitions are arrangements made by organizations to display their products or services to prospective clients.
Such an act is to declare one's presence in the field and show that there is yet another player who is interested in providing the offering to clients.
Some other reasons for organizing exhibitions can be 'to announce a change or modifications' in products or operations. Such showcasing acts help organizations reach a good enough mass of people in less time and at the same place. This way, they can communicate with them on instant basis and also address to their queries effectively.
Direct and face-to-face conversation made possible by this mode of interaction is its strength. Such exhibits make up for potent two-way communication platforms.
In some instances, organizations often go for providing demonstration sessions also. Consequently, one can win over the onlookers' trust immediately. Further, even if it is not possible to draw positive reactions every time, the feedback attained during these exhibits and trade displays is definitely something that can help organizations in bringing 'healthy and attractive amendments' in their products.
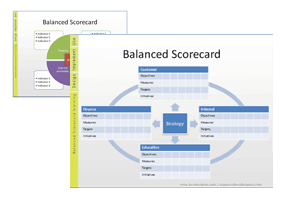
To make use of these exhibitions and trade shows, one can use the 'metrics studded' approach popularly called a 'balanced scorecard'. Cyclic consultation to this tool is all that takes for effective tracking and following of the vents and movements.
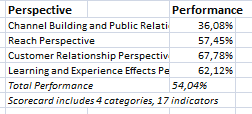
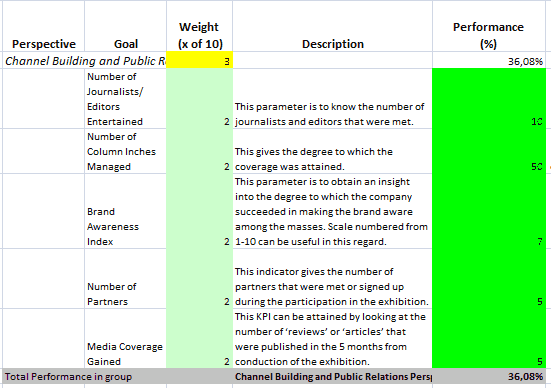
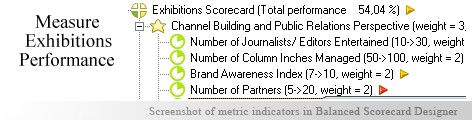
This is the actual scorecard with Exhibitions Measures and performance indicators. The performance indicators include: channel building and public relations perspective, number of journalists/ editors entertained, number of column inches managed, brand awareness index, number of partners, media coverage gained, reach perspective, average target audience concentration, average length for which the event was attended, comparison scaling, percentage rise in number of visitors, customer relationship perspective, level of customer relationships, customers’ education index, improvement in reputation and relationship scores with customers, positive responses’ fraction, learning and experience effects perspective, cost: benefit ratio improvement, learning curve effect, increase in conversion rate, number of exhibitions organized.
Download a trial version of Exhibitions Estimation Balanced Scorecard or purchase a full version online.
How is this book different from 796 other book titles about KPIs on Amazon?
"Before writing a single line, I formulated some guiding principles, one of them was: "If our clients ask, "How can I find a good KPI for..." - I want this book to provide a perfect answer."