 Managing Financial Securities is a cumbersome task owing to the dynamic nature of factors, which have a bearing on their performance. However, one can avoid getting boggled by the incredible volume of statistics, rather tilt these in own favour by using an effective tool such as KPIs.Using parameters categorized under 'Risk perspective', 'Growth Perspective', 'Liquidity Perspective' and 'History and Past Performance perspective', maximum can be extracted from these. Risk Perspective can be takes into account indices like Sharpe ratio, Treynor ratio, Jenson's ratio and Volatility Comparison Index. Effective gauging of these KPIs would help in managing the risk aspect of the securities.Growth Perspective would be helpful in knowing the progress of the securities in quantitative terms with KPIs like % rise in turnover, EPS rise index, market ranking and % increase in the volumes of shares traded. Liquidity can be measured by employing reliable ratios like cash ratio, current ratio, quick ratio and operating cash flow ratio. Past Performance can be had from '% increase in the number of investors who put their money in the concerned security', 'fraction of investors who rated the given security as favourable', '% rise in the return of security' and 'Portfolio inclusion Index'.
![]()
![]()
![]()
Read Why do business professionals choose ready-to-use KPIs? to find out the answers to these questions:

Ideally, you need to have a strategy (in a form of a strategy map) before you start thinking about the ways to measure its execution (KPIs). Don't have a strategy map yet? Use free Strategy Map Wizard to create a strategy map for your current business challenges. The wizard will:
The whole process takes on average 6 minutes. Give it a try right now - it's free.
Financial Securities make up an essential constituent of financial market that need to be managed in a thoughtful manner. Each such component of financial market has its own set of risks and returns. The decision as to which of these is to be included in a given portfolio depends upon the 'risk bearing ability' and 'return desired'.
These are negotiable and fungible instruments that can be categorized into two groups- debt securities and equity securities.
However, the exact qualifications which a given financial instrument must confirm to in order to be tagged as 'security' varies in each country. Some of the bases on which financial assets can be classified are- degree of liquidity, term to maturity, ownership rights, tax treatment, credit rating etc.
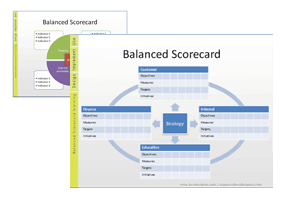
This world of financial tools is a complicated field that demands a high level of understanding about the underlying principles and basics. Therefore, to operate successfully and beneficially in this area asks for a balanced scorecard. This will have all the 'countable' metrics that count in the way to make it easy for the user in monitoring the proceedings.
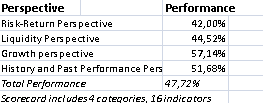
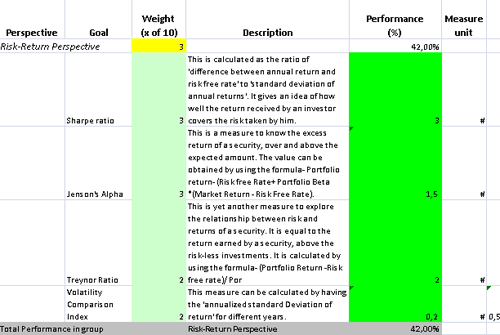
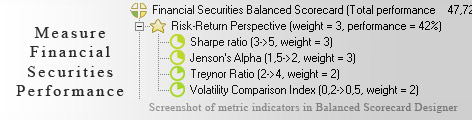
This is the actual scorecard with Financial Securities Measures and performance indicators. The performance indicators include: risk-return perspective, sharpe ratio, jensons alpha, treynor ratio, volatility comparison index, liquidity perspective, cash ratio, quick ratio, current ratio, operating cash flow ratio, growth perspective, % rise in the organizations turnover, rating in the market share ranking report, eps rise index, % increase in the volume of shares traded, history and past performance perspective, % increase in the number of investors, % rise in the return of security, favourable rating index, portfolio inclusion index.
Download a trial version of Financial Securities Evaluation Balanced Scorecard or purchase a full version online.
How is this book different from 796 other book titles about KPIs on Amazon?
"Before writing a single line, I formulated some guiding principles, one of them was: "If our clients ask, "How can I find a good KPI for..." - I want this book to provide a perfect answer."