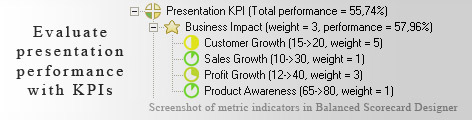
 The value of the presentation is determined no only by the quality of the information, the delivery manner of the presenter, his/hers communication skills and the efficiency of the visuals used during the presentation. The first and foremost indicator of the presentation success is the effect it has on the business itself. If a significant part of the presentation audience has become the customers of your business which will inevitably result in the increase in sales and profit it means that the presentation has been a real hit. Even if the presentation will not turn the bulk of the audience into direct customers of the business but will considerably increase the product awareness it may be still judged a success.
![]()
![]()
![]()
Read Why do business professionals choose ready-to-use KPIs? to find out the answers to these questions:

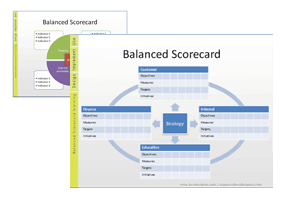
Ideally, you need to have a strategy (in a form of a strategy map) before you start thinking about the ways to measure its execution (KPIs). Don't have a strategy map yet? Use free Strategy Map Wizard to create a strategy map for your current business challenges. The wizard will:
The whole process takes on average 6 minutes. Give it a try right now - it's free.
Presentations form an important part of business conduction. Managers are often seen involved in preparing such documents to take forward their interest of delivering information to those interested in grabbing the information.
There are a large number of factors that determine the success of these activities. One has prepare the components with extreme care as 'short time duration' is one of the characteristics of this mode of communication. Therefore, appropriate tools and accessories are to be brought to deliver an effective presentation session.
By using a statistical tool to improve this act, one can bring bout gradual improvements in it. This instrument can be a Balanced Scorecard (BSC), which is an apt way to bring the 'specific' and 'countable' metrics on a single platform.
These metrics are commonly referred to as KPIs (Key Performance Indicators) and have been utilized in umpteen organizations and sectors to help improve their processes.
Consequently, presentations too fall in their domain. One can appropriately monitor the way this procedure has been going by classifying indicators in manageable number of groups.
Moving on, by making regular visits to the scorecard, one can ensure success in presentation style and manner.
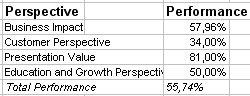
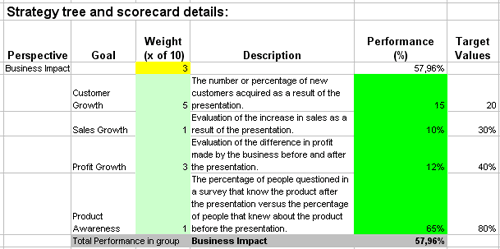
This is the actual scorecard with Presentation Indicators and performance indicators. The performance indicators include: presentation kpi.
Download a trial version of Presentation Evaluation Balanced Scoreboard or purchase a full version online.

How is this book different from 796 other book titles about KPIs on Amazon?
"Before writing a single line, I formulated some guiding principles, one of them was: "If our clients ask, "How can I find a good KPI for..." - I want this book to provide a perfect answer."