Balanced Scorecard Designer (BSC Designer) is a Balanced Scorecard design software that helps with building Balanced Scorecards for business performance management and alignment purposes.
 Our
History
Our
HistoryA few years back, we designed our first balanced scorecard design software, Strategy2Act. It was (and still is available for download) a great software product which allowed the creation of scorecards. We have obtained a tremendous amount of feedback from our users. We found that Strategy2Act software was hard to use and lack some important integration features.
That's why we released Balanced Scorecard Designer. It's a brand-new version of Strategy2Act, actually, it is completely different product, with many more design and integration features.
Balanced Scorecard Designer has a plain, easy to use interface, which provides user with:
The results of the design can be saved into BSC native format (.bsc file type) or exported to MS Excel for further usage. The Export feature is very important as the Balanced Scorecard exported to MS Excel can be used to connect the data from company ERP system with performance measurement. Starting in version 1.3, exporting is also available with command line interface.
The newest version of Balanced Scorecard Designer displays performance indicators values grouped by date, the visualization in the form of performance charts is also now available. The performance chart provides user with date-by-date performance changes dynamics.
 When you run the Balanced Scorecard Designer the default project
will be opened. You will be able to start with design process
immediately.
Using toolbar buttons, you will be able to add more categories and indicators, move items or run the balancing function. Also, with tool bar "Report" button you will be able to export results into a MS Excel file.
![]() The
special toolbar was designed to manage concurrently with
time points. With time
points, the user can specify different performance and weight values for
different dates.
The
special toolbar was designed to manage concurrently with
time points. With time
points, the user can specify different performance and weight values for
different dates.
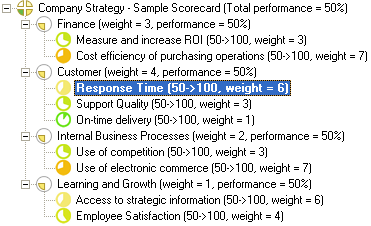 In Balanced Scorecard Designer you will work with strategy tree. The
strategy tree includes:
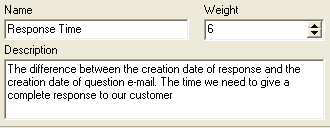
You can click on any item (Category or Indicators) and you will see the information about that item below. The information includes:
If it is necessary to specify more detailed description for the indicator use attachments.
Please, note: you can change the values right now and the changes will be immediately processed and shown at strategy tree. BSC Designer will automatically recalculate the performance values.
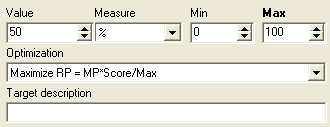 The
indicator item, also known as metric or goal has
some addition parameters.
Indicator has:
Attachments - working on operational level
 Document
and web-link attachments are supported in BSC Designer. Right-click on
indicator or category to access the context menu and select there
Edit attachments list command.
Attachments in BSC Designer is a great way to support work on operational level, providing management and employees with easy to use mean for exchanging data.
Read more about attachments in BSC Manual.
 Balanced
Scorecard Designer has many more useful features than Strategy2Act. The
significant difference is the ability to create sub-categories.
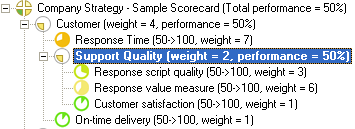
For instance, in Balanced Scorecard Designer one can create a global category "Customers", with metrics "Response Time", "On-time delivery", "Support Quality", but at the same time the "Support Quality" might be a category itself, e.g. contains more specific metrics, such as "Response script quality", "Response value measure", "Customer satisfaction" measures.
![]() Stop
lights allows to review the scorecard, alignment business
performance and find indicators that
require attention. There are three colors of stop light - green, yellow
and red. Green means great performance, yellow means normal performance,
red means low performance.
Stop
lights allows to review the scorecard, alignment business
performance and find indicators that
require attention. There are three colors of stop light - green, yellow
and red. Green means great performance, yellow means normal performance,
red means low performance.
 User
have an option to:
Decide whether display stop light of certain color;
What performance value is relevant to certain stop light color;
The stop lights will also be displayed in Dashboard report
Download the latest version of Balanced Scorecard Designer with support of stop lights, download the trial version or purchase a full version.
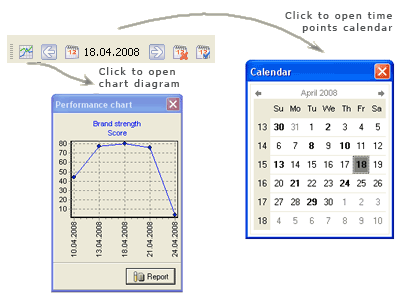
The scorecard is not just a static document, it is a set of values that can change in time. With BSC Designer, the user can specify different values for indicators for different time points.
 For
instance, the indicator "HR Interview Performance" can have a value
of 70% for
September and a value of 75% for October. That is how manager can
specify data for the past and for the future, aligning business
performance. This is the way how to
analyze company's performance in the past and in the future, e.g. plan
performance changes and set goals.
To work with the time point, the user should follow these simple steps:
Use the calendar on the toolbar and select the appropriate date.
Change values of indicator (you can change weight, value, min, max values)
Click anywhere and the program will remember the changes that you have made.
Check out the time points in Balanced Scorecard video on YouTube.
Read more about using Time Points in the BSC Designer manual or download a fully-function trial version and try it yourself.
 This
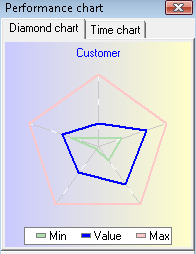
type of chart was designed to represent indicators as a dashboard,
giving executive manages a powerful visualization tool, which helps with
representing current and target values of indicators.
On the sample picture: blue bold line is the current value. Triangle inside is minimal value. Triangle outside is maximal value.
To access Diamond type chart you should click on the category, which contains three or more indicators and then switch chart window into diamond chart mode. Double click on this diagram to access more details.
Also, Diamond type chart is available in Dashboard report. This type of report can be generated for a certain data point. There are two options: the first is generating report for all balanced scorecard and the second is generating report only for certain branch of the scorecard.
Both reports are available from Reports menu. Download the latest version of Balanced Scorecard Designer with rich reporting abilities, download the trial version or purchase a full version.
Cascading scorecards. Connecting to external scorecards
 For
efficient performance improvement and management with Balanced
Scorecard, it is not enough to create just a top-level scorecard for top
managers. The scorecard should go deep into the organization structure,
e.g. scorecard of CEO should be linked to scorecards of top managers and
scorecards of top managers should be linked to scorecards of their
employees. That idea is called Cascading
Scorecard.
In BSC Designer we have not limited the cascading to any particular technique - users are free to use just certain data for cascading purposes (using SQL indicators), and it is also possible to create cascades of scorecards, e.g. link together scorecard located in the company network or on the company's server.
With Balanced Scorecard Designer, the user can not only design his own indicators, but also link to indicators in other external scorecards.
Download the latest version of Balanced Scorecard Designer that supports cascading scorecards, download the trial version or purchase a full version.
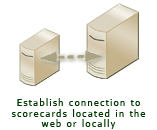
For instance, the manager of the HR department can place his scorecard on the web-server. The CEO of the company can connect to this scorecard and use its indicators or performance values of the whole category or the performance value of the scorecard.
This way, the user can link to scorecards located on the web site, file in the network or hard disk.
Learn more about linking scorecards or download trial version of Balanced Scorecard Designer to try this function yourself.
Link balanced scorecard with ERP, CRM or other business systems
Balanced Scorecard Designer, starting in version 1.8, can create SQL indicators. The SQL indicators use ADO technology to access data from various data sources and databases.
With SQL indicator, one could access information located in almost any database or business system, such are ERP, CRM, EMC.
This is a great example on how independent developers and our partners could integrate Balanced Scorecard Designer into an existent business environment.
Learn more about creating SQL indicators here.
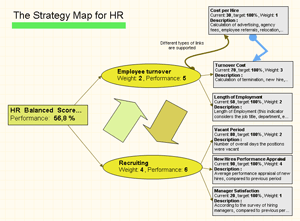 Strategy
map is a great way to represent visually the Balanced Scorecard in the
way you want it to appear.
BSC Designer can automatically export the indicator objects into the map, creating necessary links.
In addition, user can add some custom objects, such as text blocks, large arrows, different types of links.
Download the latest version of Balanced Scorecard Designer with strategy map, download the trial version or purchase a full version.
From the object on the strategy map , it is easy to navigate to object in the indicators set and back. All modifications made to indicator are immediately shown on the map.
Strategy map in Balanced Scorecard Designed became a great easy to use mean to create nice-looking maps for KPIs. Basic supported visual functions are gradient, shadow, rotation:


More over, BSC Designer can automatically create some nice looking strategy maps for almost any balanced scorecard, here how they might look like:
Learn more about strategy maps in online manual.
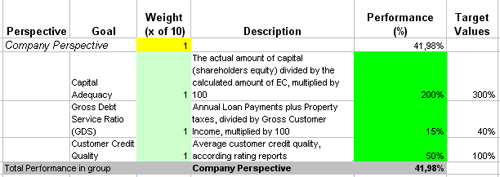 Balanced
Scorecard Designer can export the scorecard into an Excel file. It is a
really useful feature, as Excel files are an easy way to share and analyze
information. Also, having indicators represented in Excel file it is
easy to export or import data from some external data sources and
databases.
The data exported into Excel is available for change, so if user will change some performance values the Excel will calculate the new performance values for category and the scorecard.
Exporting to Excel is easy, just select "Export to MS Excel" command in Reports menu. Please, note: the export to Excel is limited only to one time-point, so if you need to export data for some time interval, please, use HTML report.
Right now you can download trial version of Balanced Scorecard Designer to try exporting to Excel and other features.
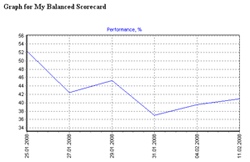
HTML report is a great way to share Balanced Scorecard with others. There are 3 types of HTML reports with different level of details.
The html report can be customized using "Custom values" and "Custom files" tag from document properties dialog.
One of the possible export report formats is "Overview Report". This type of report contains information about top-level indicators and groups in Balanced Scorecard. The "Overview Report" is a good starting point for any education, training or presentation related to Balanced Scorecard.
The "Overview Report" as shown on the Balanced Scorecard Sample screenshot has information about main categories (in our case you can see four main categories) and information about each top-level indicator in the category.
The indicators are listed in the tables together with their descriptions.
In the center of the report there is an information about Balanced Scorecard, its name, description and author.
The Overview Report is generated as .htm file, so it is easy to share it with co-workers, for instance, by placing on a web-server or printing out from web-browser.
Please, note: the Overview Report is limited only to top-level categories and indicators. This report is for presentation purposes, because it doesn't contain some valuable performance values, so if you need more detailed report, use Advanced HTML Report.
Right now you can download the evaluation version of Balanced Scorecard Designer. We suggest to try the fully functional version of BSC Designer for 30 days at NO cost!
If you will find Balanced Scorecard Designer a useful tool, you can purchase a full version online.